I see the Android app is not open source. That is very unfortunate. Can anyone explain how the DF algorithm and visualization stuff is working?
I have the following flow graph:
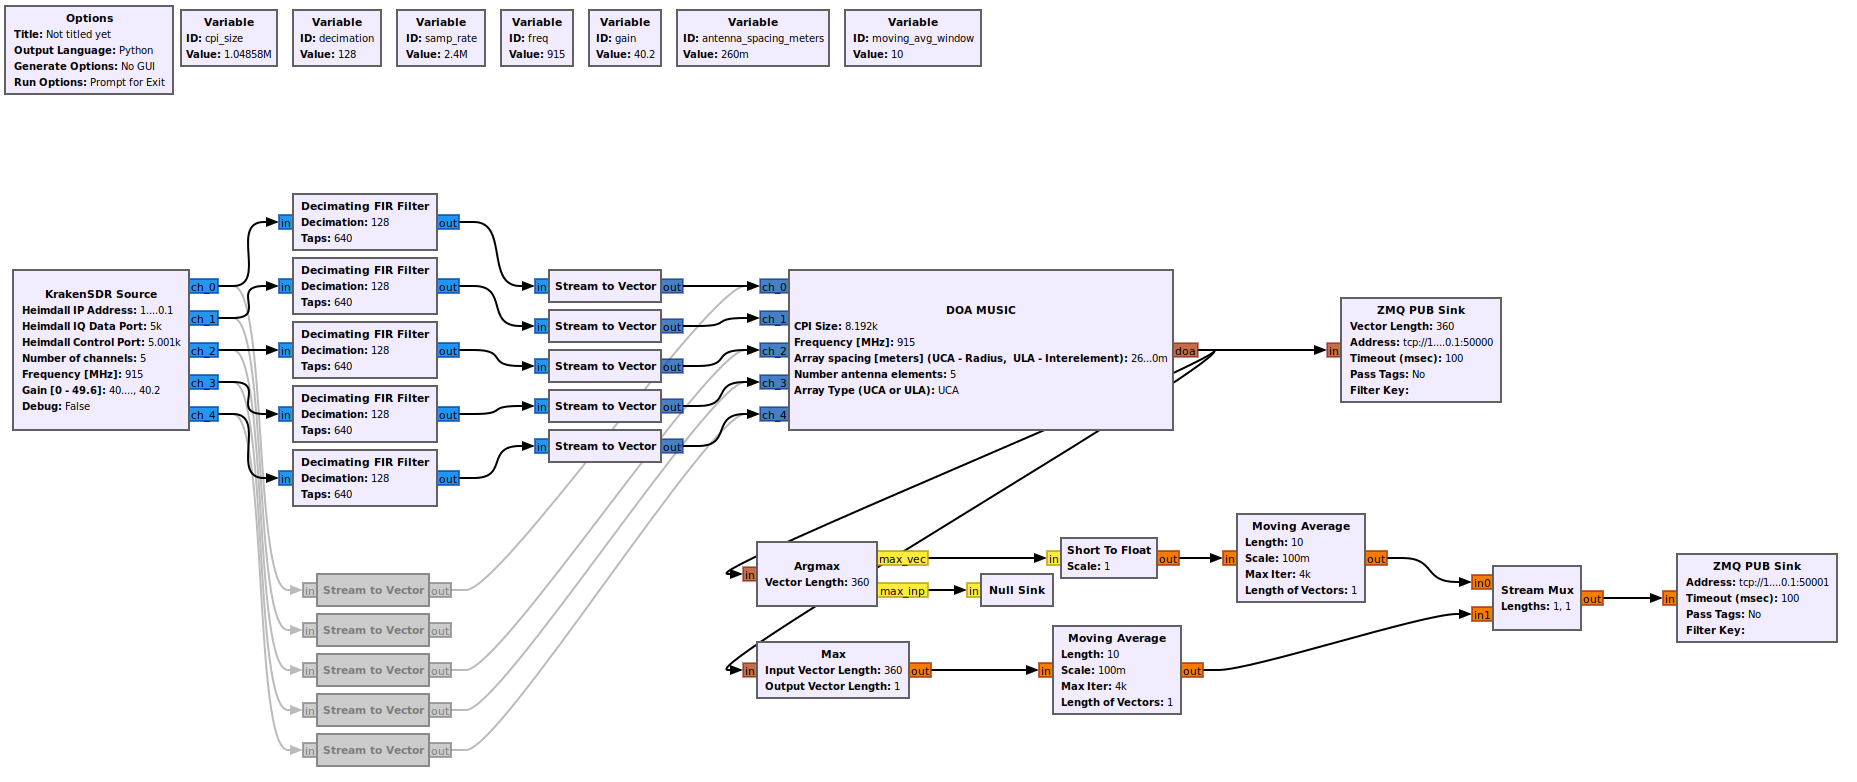
Basically I am just looking at the peak out of the 360 deg output. It is VERY noisy. I tried to add a moving average block, but this doesn’t help much. Maybe if I maintained a very long average over time it would help, but I feel like I am reinventing the wheel.
What is the theory of operation for the Android app? Is it doing much more processing than that? Is it even using MUSIC at all when using that?