Hi everyone! First of all, thank you for your amazing job with the Kraken SDR, I’ve been using it for a month, and i have a doubt with the Polar plot.
I have a personal Api, that obtain the data from Kraken HTML page at “http://PI4_IP_ADDR:8081/DOA_value.html”.
As you describe:
- “18-377. Full 360 degrees DOA output. First element specifies DOA power output at 0 degrees, second element power at 1 degrees etc. NOTE: Uses unit circle convention, so due EAST is classed as 0 degrees, NORTH 90 degrees and so on. Needs to be rotated into compass convention.” *
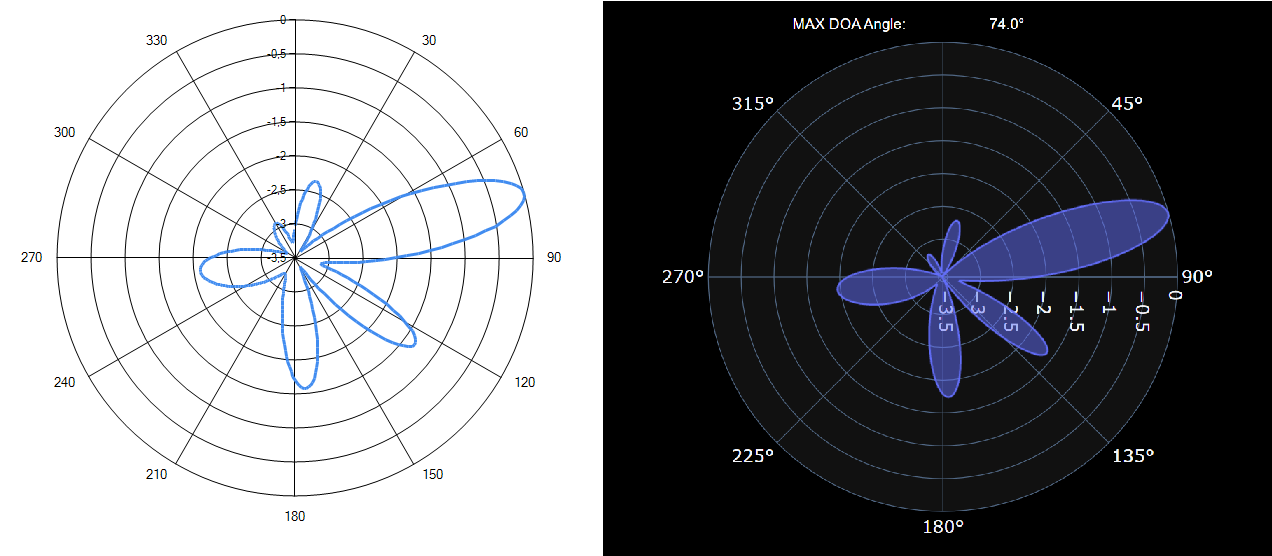
If I plot the 360 dB Values in a Polar Graph. I get the same plot as in “http://PI4_IP_ADDR:8080/doa”, but the problem is that I don’t have negatives values in the plot as you have (higher negative value in the center and 0 dB in the outter circunference.
So i came with a solution, I convert all 360 values to negative values. That fixed the axis problem with negative values, but the plot that i get it’s not like the one you draw.
So my question is, how do you plot it with that values? Am I doing something wrong?
I attach some examples of my tests.
Thank you all in advance.