Intro:
In the following description and explanations I post a change request about analyzing doalog files with two or three lobes (RF=2/3) with Kraken V1.7.0 release.
As Is:
With Kraken release V.7.0 the user is able to search/find with a mobile drive/measurement and setting parameters
- Decorrelation = On, i.e. MUSIC algorithm = Toeplitz and expected number of RF sources = 3
RF stations based on lobes for more than one RF station sending on the same frequency with TDMA procedure. After a measurement session an analyzation in Kraken App can be showed two or three lobes with yellow lines on grid map.
Detailed steps for an analysis procedure:
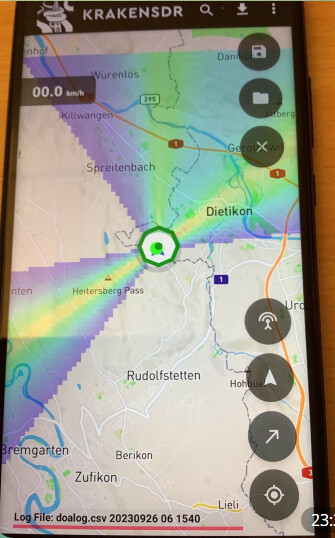
First, in Kraken App the user can select a doalog file and zoom into the map grid. Select a measured point. The shown information in the white square box can’t be taken with V1.7.0 for further analysis. The user sees for selected measure point it’s yellow lines, that show the lobe or lobes. The user has to zoom out to see the two or three yellow lobes, and it’s direction. He has to zoom out even more to detect a possible target in a greater distance. With the next step, the user must zoom in again, select another measured point and perform the same steps mentioned above again. This is not an effective way for analyzing a doalog file with two or three yellow lobes.
Second, in Kraken App the user can select a doalog file, and set the thin blue lines to i.e. 0.1 km. Than the user can for analysis zoom out on the grid map. Now, the user can’t see the thin blue lines, and in release V1.7.0 not relevant, anymore for several lobes. The user can recognize in the grid map the two or three lobes marked with different colors.
Further details see attached picture below. If you need more pictures or information please let me know.
To be:
The user shall have the ability to analyze in Kraken App doalog files with two or three yellow lobes in different distance. He should have the ability to see the direction of two or three lobes. The user shall have the ability to set a distance, because the yellow lobes are i.e. quiet near in 2-4 km distance, but the RF target can be farer away.
Can you please analyze my change request for a possible feature in the future? Thanks a lot.