Android 15 Feb 2025 Security Patches

My Google Pixel 8 Pro forced an update to Android 15 for security reasons and now I cannot access the KrakenSDR Server Settings from the app. I only get a blank page when I connect to the IP address of the Pi5 and if I try to run the app anyway, nothing logs, so I assume it is not communicating with the server. Net Analyzer also gives a notice that IDing IP addresses on the hot spot network is no longer allowed. Is anyone else having this issue and have you found a work around? Thanks in advance.

Also note, using the app on Samsung tablet connected to the same phone hot spot has the same issue. Only get a blank page when it connects to the server IP address.

Can you still connect to the page via the Chrome browser?

Observations on Android 15:

  • After updating from app version 3.6.9 to 3.7.0, on-screen tracking/updates start to bog down after about 30 minutes and soon stop altogether: On-screen display becomes intermittent/sluggish. A reboot of the tablet will restore operation, but I haven’t checked to see if simply exiting/restarting will do so.

  • On app version 3.6.9 (haven’t checked on 3.7.0 due to its stopping working on its own) after running for a while, all map tiles would disappear (blank screen other than indicator for current location - added markers disappear as well) and it would no longer display bearings and it would stop updating vehicle speed on the screen. This often occurs after going into and coming back out of config menus. Connectivity to the RPi was confirmed as data updates are continuing on the web page. It takes a complete reboot of the tablet to restore operation.

Regards,

CT

Yes, I can still connect to the server via the web browser. After rebooting the system several times, it is now working through the app.

Separate note, perhaps related. When playing back the log files, the IP address changes in the app settings. The issue I was experiencing may have been due to the wrong IP address, but I check that every time I start the system. Thanks for looking the reply and looking into this.

Thank you CT. I am running 3.7.0.

Hm very odd, nothing in 3.7.0 relating to performance should have changed. It’s just a fix for the Android 15 padding requirements. Will look into it.

Can you please share exactly what device you are using?

Can you please share what device you are using? I haven’t been able to replicate this on my devices or the simulator.

Sorry for the delay in replying - there seem to be a number of problems stacked up.

First, the device: I’ve been mostly using a generic, cheap Android 15 tablet (“Headwolf” brand, if that helps). For the most part, the issue was buttons appearing on top of the app - but with the screen as large as it is, they are a minor annoyance rather than preventing it to be used.

The “other” problems:

Perhaps the problem, I noticed that I stopped getting updates from the Pi5: I would go to the server (on the Pi) and see, in the configuration screen, signal levels varying as I would expect - but if I went to the spectrum screen I would see no data and a frequency scale starting at “0” on the left side - and in the DOA Estimation screen - a straight line at zero degrees.

The above would happen no matter how I accessed the unit - different platforms/computers and browsers showed the same problem, implying that the application on the Pi5 was hosed somehow.

Re-imaging the SD card restored “normal” operation of the server on the Pi - but even though I can now see the stats and the DOA Estimates via the KrakenSDR app, I’m no longer getting any bearing information from it, despite setting thresholds (velocity, quality, signal level) to cause it to “always” show DOA data, I get nothing: This is after deleting/reinstalling on the Android tablet - and it doesn’t work on the previously-working Android 11 phone, either.

There are still a few things that I can try, but this is quite unlike when I originally set it up and it “just worked” with no issues: Now, I can’t get anything to work with the app.

FWIW, I’m connecting using a non Internet-connected private network which seems stable (e.g. I can connect to the Pi5).

CT

A bit more information.

As noted, I re-flashed the SD card for the RPi5 - but while I can, once again, get a DOA indication via the web interface, two of the Android devices will no longer work.

Following the “troubleshooting” I see that I can get to the RPi’s UI via port 8080 and also get the raw “DOA_value” data from port 8081 - this on both of the devices that no longer working App.

I have also disabled “Pause Data Collection When Stationary” in the app, as well as made sure that the “confidence” value is zero.

I can download maps and they will display properly, and I see my own velocity and my marker moves along the map as it should - but I’m getting absolutely nothing from the Pi itself: Again, I can get to the Pi interface via the app itself and can see the configuration screen and the DOA compass view just fine.

I suspect that there’s something amiss with App version 3.7.0: Since both my no-name Android 15 tablet and my Motorola Razr (Android 11) phone have updated it hasn’t worked.

I then remembered that I had tried it originally using BlueStacks which worked, but was painfully slow: This - running App version 3.6.something - DOES work.

Is there something that I’m missing here - perhaps some permission setting?

At the moment, I’m considering side-loading an older version, but I’m not sure that I trust any of the sketchy web sites - or the equally-sketchy “xapk” apps out there.

Any suggestions on where to go from here?

Thanks,

CT

Are you sure that the signal was not just being squelched (as in there was currently no signal in the VFO)? This is exactly what I would expect to happen when the KrakenSDR is squelching.

I double checked the changes in 3.7.0 and there is really nothing changed with the network code, it was just an adjustment to rescale things properly under the new Android 15 requirements.

These are probably not real, the app is protected and it shouldn’t be possible to be on third party sites.

Still having problems KEEPING the KrakenSDR App working.

I’ve been using a generic Android 15 tablet, and it worked perfectly for several weeks after bringing it online in January using version 3.6.x: The problems coincided with Version 3.7.0 - but I can’t be certain that that was the actual cause. It also stopped working on my Android 11 phone (Motorola Razr) at around the same time - same symptoms as on the tablet.

Laying out the symptoms, again (on the tablet):

  • I’ve been running it on my commute - letting it log a transmitter in a known location and to get familiar with it. I have the “sound” turned on (the chirping noise) just to let me know that it’s working without having to look at it.
  • I learned early on that if the tablet goes to sleep, this will temporarily “break” the app (no maps will be displayed - just blank) - requiring a complete reboot.
  • After a week or so of using it in this manner 2-3 times per week, it will start to “flake out”: As noted earlier, it will work for about 20-30 minutes, but then TDOA readings will start to get erratic: The chirps will occur less-frequently: As I’m retracing steps on my commute, this is a known good location with good signals.
  • After a few more operating sessions, the app will seem to completely stop getting TDOA data from the Pi5.

When it gets to this point:

  • If I click the “start tracking” button (the arrow at an angle) it goes green. I see my location move on the map, and I see the speed indicator on the app - but I get no bearing/plot data.
  • Via the app, I can see the display of the UI from the RPi: I see the signal level data, live - which is updating properly - and I can see the “DOA” display, which is also updating properly.
  • I can go into a browser (Chrome) and also see the RPi screen (port 8080).
  • I can - using the same browser - go to port 8081 and see the live DOA data.
  • Following the troubleshooting page, I can set the logging mode to “Log Everything” and make sure that the “Minimum Required Confidence” is set to zero (default) and that the “Minimum Required Power” is also set to -200 (default) and I get nothing.
  • There is plenty of storage space left on the device.

From here, the ONLY way that I have been able to get the app to work again with certainty is to:

  • Blank the SD card on the RPi and re-image it. I’m not entirely sure that this step is necessary, but it’s easy to do as it assures a clean slate.
  • Do a “Factory Reset/clear” on the Android tablet to completely wipe it and reinstall the Kraken app. Simply uninstalling/reinstalling the app will NOT restore its operation.

I have been unable to get the App to “see” the DOA data on my Android 11 phone despite uninstalling/reinstalling the app (Note: On my phone, via the app, I can see the RPi information screen and see the DOA graphic - both of which work fine - as does using a Browser to see the RPI on ports 8080/8081 as noted above). Clearly I have no intention of doing a “Factory Reset” on my phone.

I’ve had to do the above “blow everything away and start fresh” on the tablet three times - and I’m about to do do it again as the App has, again, stopped “seeing” the DOA data - but in doing this, I fear that the app will work only “temporarily” once again.


Taking this as an opportunity to do some additional diagnostics, what else should I be trying to do to troubleshoot? AFAIK, there’s no real diagnostic/log or status display on the App itself to indicate why it isn’t working.

As a reboot or uninstall/install does not seem to help once it gets into this state, it would seem that there is some file/cache corruption somewhere that is persisting: Is there something in the file system that would be worth checking or deleting?

At this point, the only thing that seems to be reliable is the still-useful DOA display itself from the RPi - which still works - even through the “broken” App - but it’s a shame that the usefulness of the App seems to fall over and die after a few hours of use over the period of a week or so.

Any suggestions would be gratefully considered.

CT

One useful troubleshooting step: Next time the app starts to fail after several uses, please try to clear the app caches in the Android settings. Leave the Pi 5 alone so we can rule that out.

Clearing the cache would have the same effect as wiping the device and reinstalling. At least this way we can confirm if it’s an app issue, and if something odd is happening with the app cache over time. Please try to clear the app cache on your Android 11 device too, and we’ll see if that helps.

There actually shouldn’t be much that is cached in the app, apart from the map tiles. So I’m not sure what could be going wrong especially as the only change in 3.7.0 is to make Android 15 happy with scaling.

Hello,

I have cleared the app cache on both the Android 11 and Android 15 device - and there’s no difference: A quick drive yielded no bearings in the app. I then cleared the App storage on the Android 15 device - which caused me to have to re-download tiles, give permissions and change the items in the configuration (ip address, set to “log everything”, etc.) - but this yielded no positive results, either.

To reiterate - on both the Android 11 and 15 devices:

  • The app will show my location and speed on the map, indicating that the GPS data is being used. Downloaded map tiles look correct.
  • FROM the app, I can look at the RPi - I can see the configuration data and status, and I can see the DOA screen updating, showing valid bearings to the signal source with which I’m testing (I’m using the local NOAA transmitter as it fairly near to me and is quite strong.)
  • If I hit the “start tracking” button, it goes green: A log file is created with the appropriate name, but it is zero length. This is true even if I have selected “log everything”.
  • If I use a browser, I can see the RPi on port 8080 and I can see the DOA data on port 8081.
  • It’s worth noting that I have never gotten the server address of “krakensdr” to work - I have always had to use 192.168.50.5 as I’m not using a network-connected device when in the vehicle.

Any more suggestions?

CT

The dev is investigating but so far no one has been able to replicate the issues you are having. If possible could you please provide screenshots of your settings?

Are you running with plot log lines turned on or off?

I’ve attached two screen shot of the KrakenSDR app configuration - from the Android 11 device (Motorola Razr). I compared the Android 15 tablet configuration line-by-line and they are identical now. If I uninstall the app and reinstall it - changing only the IP address, it does NOT work on either the Android 11 or 15 device.

The only notable configuration changes are:

  • Configure to “log everything” for debug purposes.
  • Set distances to 50km rather than 10km: In the local geography - mountain and bowl-shaped valley - practically ANY signal will be more than 10km distant.
  • Use of 192.169.50.5 as the server address.
  • Tone is on. This is how I know that the app falls over and dies while I am driving. (e.g. beeping slows/stops)

Plot log lines are turned OFF.

As I noted earlier, the following are observed on both the Android 11 and 15 devices:

  • Map tracking works fine: It shows my position and speed.
  • “Track” button (diagonal arrow) goes green.
  • Log files are ZERO length - even with “log everything” enabled.
  • I can get to the RPi5 and see the Status/config and DOA via the Android App.
  • Via browser on the phone, I can get to the RPi5 on both ports 8080 and 8081 and see stats/config and raw DOA data.

Not knowing how the app works internally, but since the browser works, either there’s something amiss with the built-in HTTP (browser) interface in the app or something is “poisoned” on the RPI’s server that only affects what the app is using to fetch the data from it…

The problem with this is that both devices (Android 11 phone, Android 15 tablet) quit working at about the same time - remembering that to “fix” this reliably, I’ve had to nuke both the tablet (e.g. factory reset) AND re-image the RPi5 at the same time - although this may be a red herring due to the tenuous link between causation and correlation. (After the initial “failure”, I’ve never gotten the app to pull DOA data on the Android 11 phone - and I’m not keen to nuke it, either.)

Re-imaging the RPi5 only hasn’t done the trick and I’ve held off on nuking the tablet pending advice given here in an attempt to divine what’s happening and how to fix it.

CT

So to clarify:

  1. You are connecting your phone to the WiFi hotspot created by the Pi. Your phone is not generating it’s own hotspot.

  2. Using a chrome browser on your phone to access 192.168.50.5:8080 works fine

  3. Using the Android App and going to “KrakenSDR Server Settings” does not work

If that’s the case something is really weird. Because the app literally opens a chrome browser internally and browses to 192.168.50.5:8080 when you go to KrakenSDR Server Settings.

Hi Carl,

To clarify:

  1. Yes - I’m connecting directly to the Pi, which is generating the hotspot.

  2. Yes - It works fine.

  3. Using the android App and going to KrakenSDR Server Settings DOES work - which is the really interesting part: I can see the configuration/status VIA THE APP, but the App itself can’t seem to pull the DOA data from the RPi.

CT

I did more testing.

On the RPi5 I installed tcpdump and was able to remotely use WireShark to “see” what the RPi was seeing. I have some capture files - which cannot be added here, obviously: If you wish to look at them, I can provide them, but I would need to know how to get them to you.

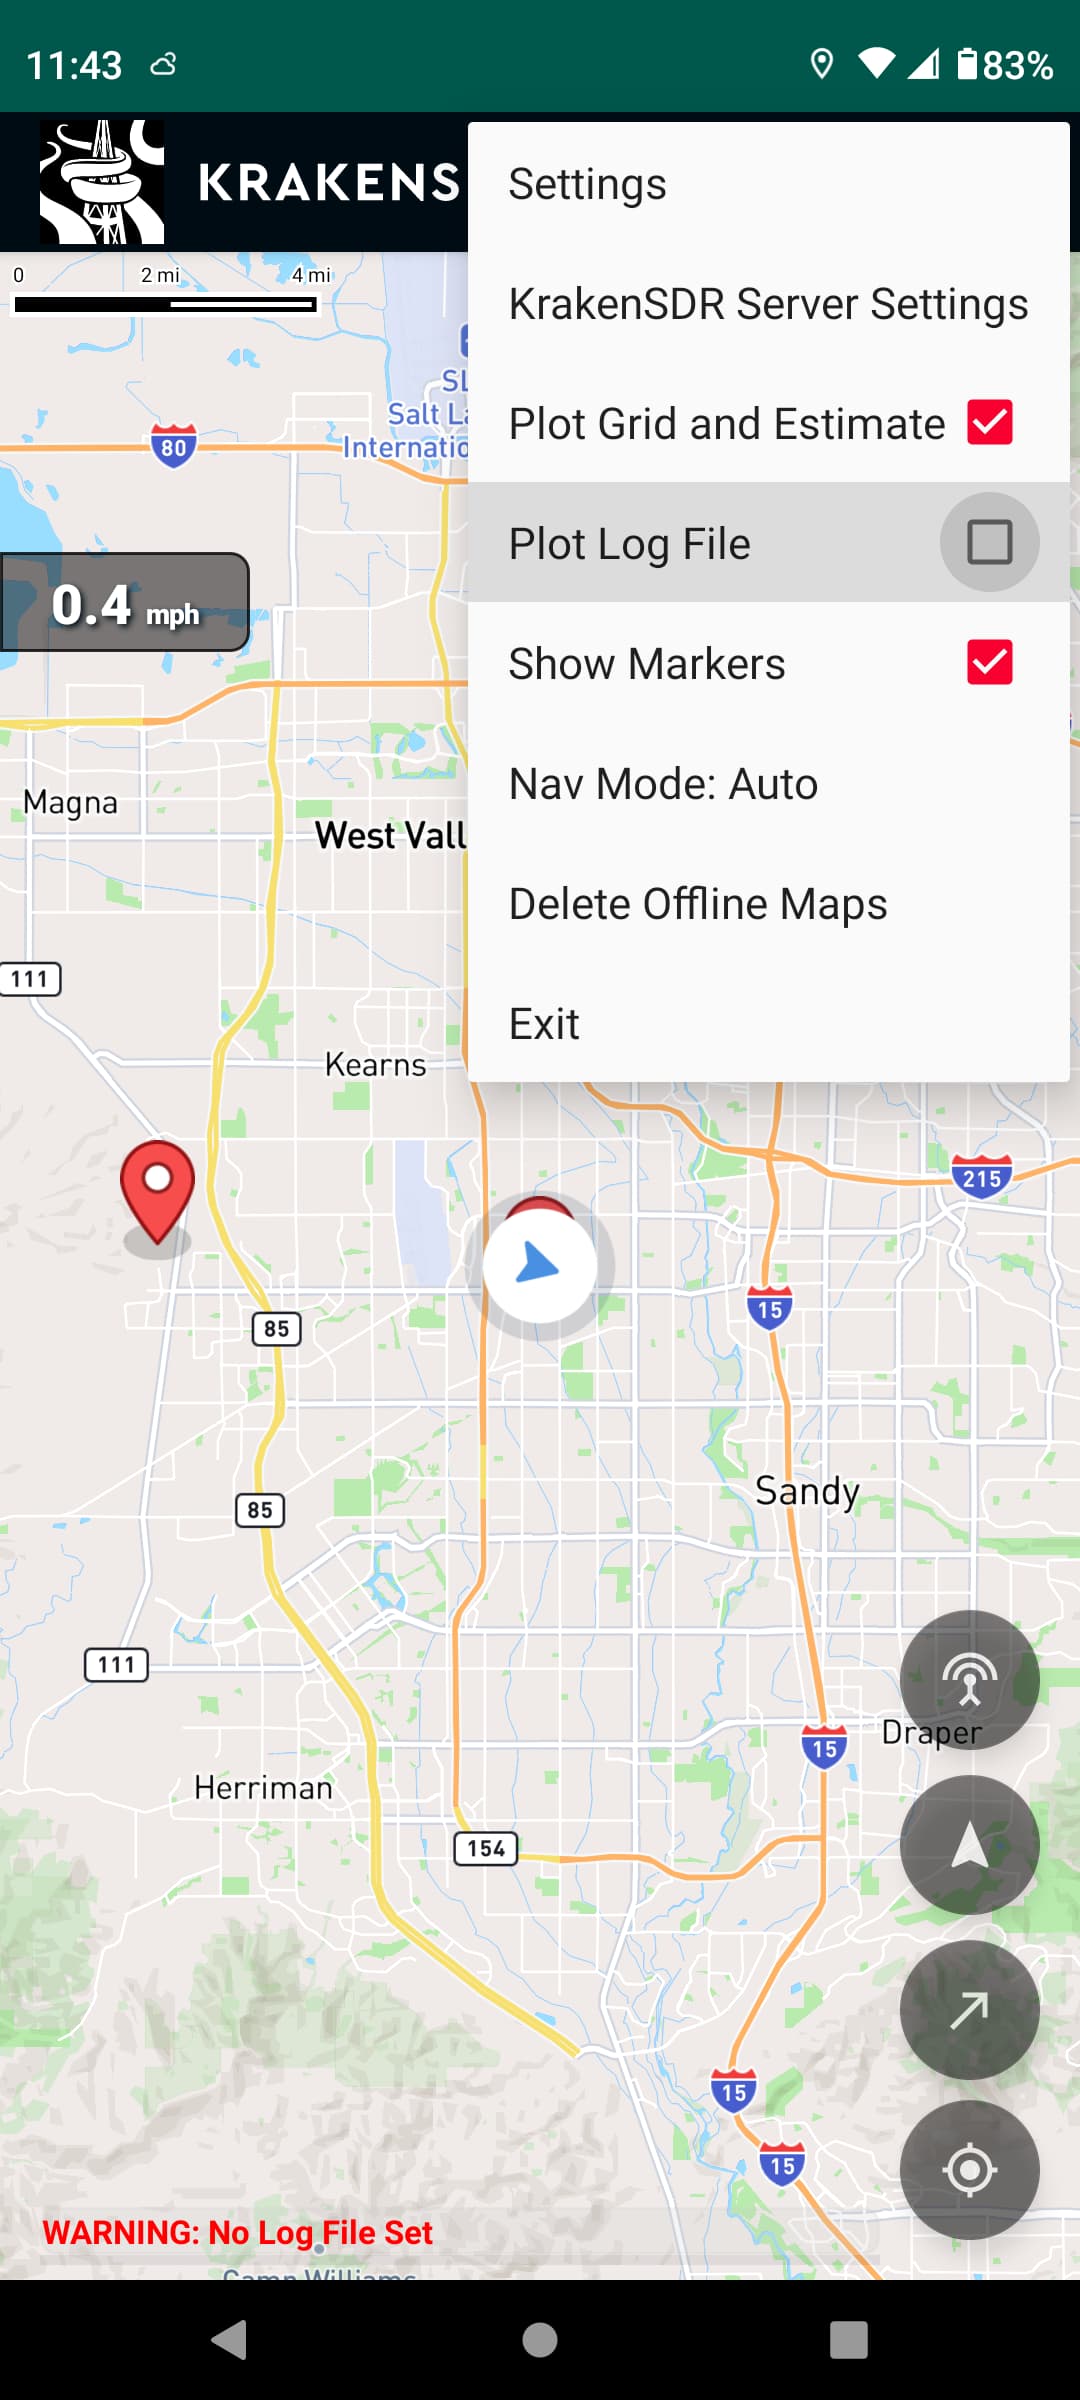
One capture file contains a capture when the port 8081 DOA data was queried ON THE TABLET from Chrome (refreshing several times) and the other capture file contains a capture when the app on the SAME tablet is running and pulling data from the RPi: To do this, I started the app, got GPS lock, defined a log file, and pressed the “Track” button - which did go green. The app is configured to “log everything” and the “show plot lines” show nothing and the resulting log file is of zero length. Note that there was no particular signal present on the receiver input at the time of the capture.

Upon examining the two capture files, they look superficially the same: Both seem to show that the DOA data is being queried - but I’m not familiar enough with the formats involved to be sure that they are actually correct.

In light of this, it would seem that the app IS pulling data from the RPi, but is not able to do anything with it.

For reference, I have included a snapshot of the DOA data captured from the browser, below.

CT

1745017521275, 185.0, 0.753173902630806, -56.117549896240234, 146020000, UCA, 436, TEST , 0.0, 0.0, 0.0, 0.0, GPS, R, R, R, R, 0.18, 0.18, 0.18, 0.18, 0.18, 0.18, 0.18, 0.18, 0.18, 0.18, 0.18, 0.18, 0.18, 0.18, 0.17, 0.17, 0.17, 0.17, 0.17, 0.17, 0.17, 0.16, 0.16, 0.16, 0.16, 0.16, 0.16, 0.15, 0.15, 0.15, 0.15, 0.15, 0.15, 0.14, 0.14, 0.14, 0.14, 0.14, 0.13, 0.13, 0.13, 0.13, 0.13, 0.13, 0.13, 0.12, 0.12, 0.12, 0.12, 0.12, 0.12, 0.12, 0.12, 0.11, 0.11, 0.11, 0.11, 0.11, 0.11, 0.11, 0.11, 0.11, 0.11, 0.11, 0.11, 0.11, 0.11, 0.11, 0.11, 0.12, 0.12, 0.12, 0.12, 0.12, 0.12, 0.13, 0.13, 0.13, 0.13, 0.14, 0.14, 0.14, 0.15, 0.15, 0.16, 0.16, 0.17, 0.17, 0.18, 0.18, 0.19, 0.19, 0.20, 0.21, 0.21, 0.22, 0.23, 0.24, 0.24, 0.25, 0.26, 0.27, 0.28, 0.29, 0.30, 0.31, 0.32, 0.33, 0.34, 0.35, 0.36, 0.37, 0.39, 0.40, 0.41, 0.42, 0.44, 0.45, 0.46, 0.48, 0.49, 0.50, 0.52, 0.53, 0.55, 0.56, 0.58, 0.59, 0.61, 0.63, 0.64, 0.66, 0.67, 0.69, 0.70, 0.72, 0.74, 0.75, 0.77, 0.78, 0.80, 0.82, 0.83, 0.85, 0.86, 0.88, 0.89, 0.91, 0.92, 0.94, 0.95, 0.96, 0.98, 0.99, 1.00, 1.01, 1.02, 1.04, 1.05, 1.06, 1.07, 1.07, 1.08, 1.09, 1.10, 1.11, 1.11, 1.12, 1.12, 1.13, 1.13, 1.13, 1.13, 1.14, 1.14, 1.14, 1.14, 1.14, 1.13, 1.13, 1.13, 1.12, 1.12, 1.11, 1.11, 1.10, 1.09, 1.09, 1.08, 1.07, 1.06, 1.05, 1.04, 1.02, 1.01, 1.00, 0.99, 0.97, 0.96, 0.94, 0.93, 0.91, 0.90, 0.88, 0.87, 0.85, 0.83, 0.82, 0.80, 0.78, 0.76, 0.75, 0.73, 0.71, 0.69, 0.67, 0.66, 0.64, 0.62, 0.60, 0.58, 0.56, 0.55, 0.53, 0.51, 0.49, 0.48, 0.46, 0.44, 0.42, 0.41, 0.39, 0.38, 0.36, 0.34, 0.33, 0.31, 0.30, 0.28, 0.27, 0.25, 0.24, 0.23, 0.22, 0.20, 0.19, 0.18, 0.17, 0.16, 0.15, 0.14, 0.13, 0.12, 0.11, 0.10, 0.09, 0.08, 0.07, 0.07, 0.06, 0.05, 0.05, 0.04, 0.04, 0.03, 0.03, 0.02, 0.02, 0.02, 0.01, 0.01, 0.01, 0.01, 0.00, 0.00, 0.00, 0.00, 0.00, 0.00, 0.00, 0.00, 0.00, 0.00, 0.00, 0.00, 0.01, 0.01, 0.01, 0.01, 0.01, 0.02, 0.02, 0.02, 0.02, 0.03, 0.03, 0.03, 0.04, 0.04, 0.04, 0.05, 0.05, 0.05, 0.06, 0.06, 0.06, 0.07, 0.07, 0.08, 0.08, 0.08, 0.09, 0.09, 0.10, 0.10, 0.10, 0.11, 0.11, 0.11, 0.12, 0.12, 0.12, 0.13, 0.13, 0.13, 0.14, 0.14, 0.14, 0.15, 0.15, 0.15, 0.15, 0.16, 0.16, 0.16, 0.16, 0.16, 0.17, 0.17, 0.17, 0.17, 0.17, 0.17, 0.18, 0.18, 0.18, 0.18, 0.18, 0.18, 0.18, 0.18, 0.18, 0.18, 0.18, 0.18, 0.18, 0.19, 0.19, 0.19, 0.19

When you refresh the DOA HTML page, or see in wireshark, can you confirm if the first number is updating? This is the timestamp.

If you can, please also show me a screenshot of your spectrum in the KrakenSDR web gui, and the settings page.

As I have access to the pcap files, I can confirm that the first number (timestamp) in the DOA data - being polled by and sent to the App on the tablet - as captured from the RPi - is, in fact updating.

I do know that the DOA screen as seen via the Web UI is updating with moving ellipsoids representing the signal (e.g. there is no straight line as would be present were the DOA process not running and operating on a real-world signal). I am pretty sure that the carrier with which I normally test (the local NOAA transmitter) shows up on the screen - but as I’m away for another day or so, an actual screen capture will have to wait until I get back.

CT